Willow Quick Start Guide
Contents
Hardware Connections
- Connect Datanode Power Supply to port labeled 12VDC on right side of Datanode.
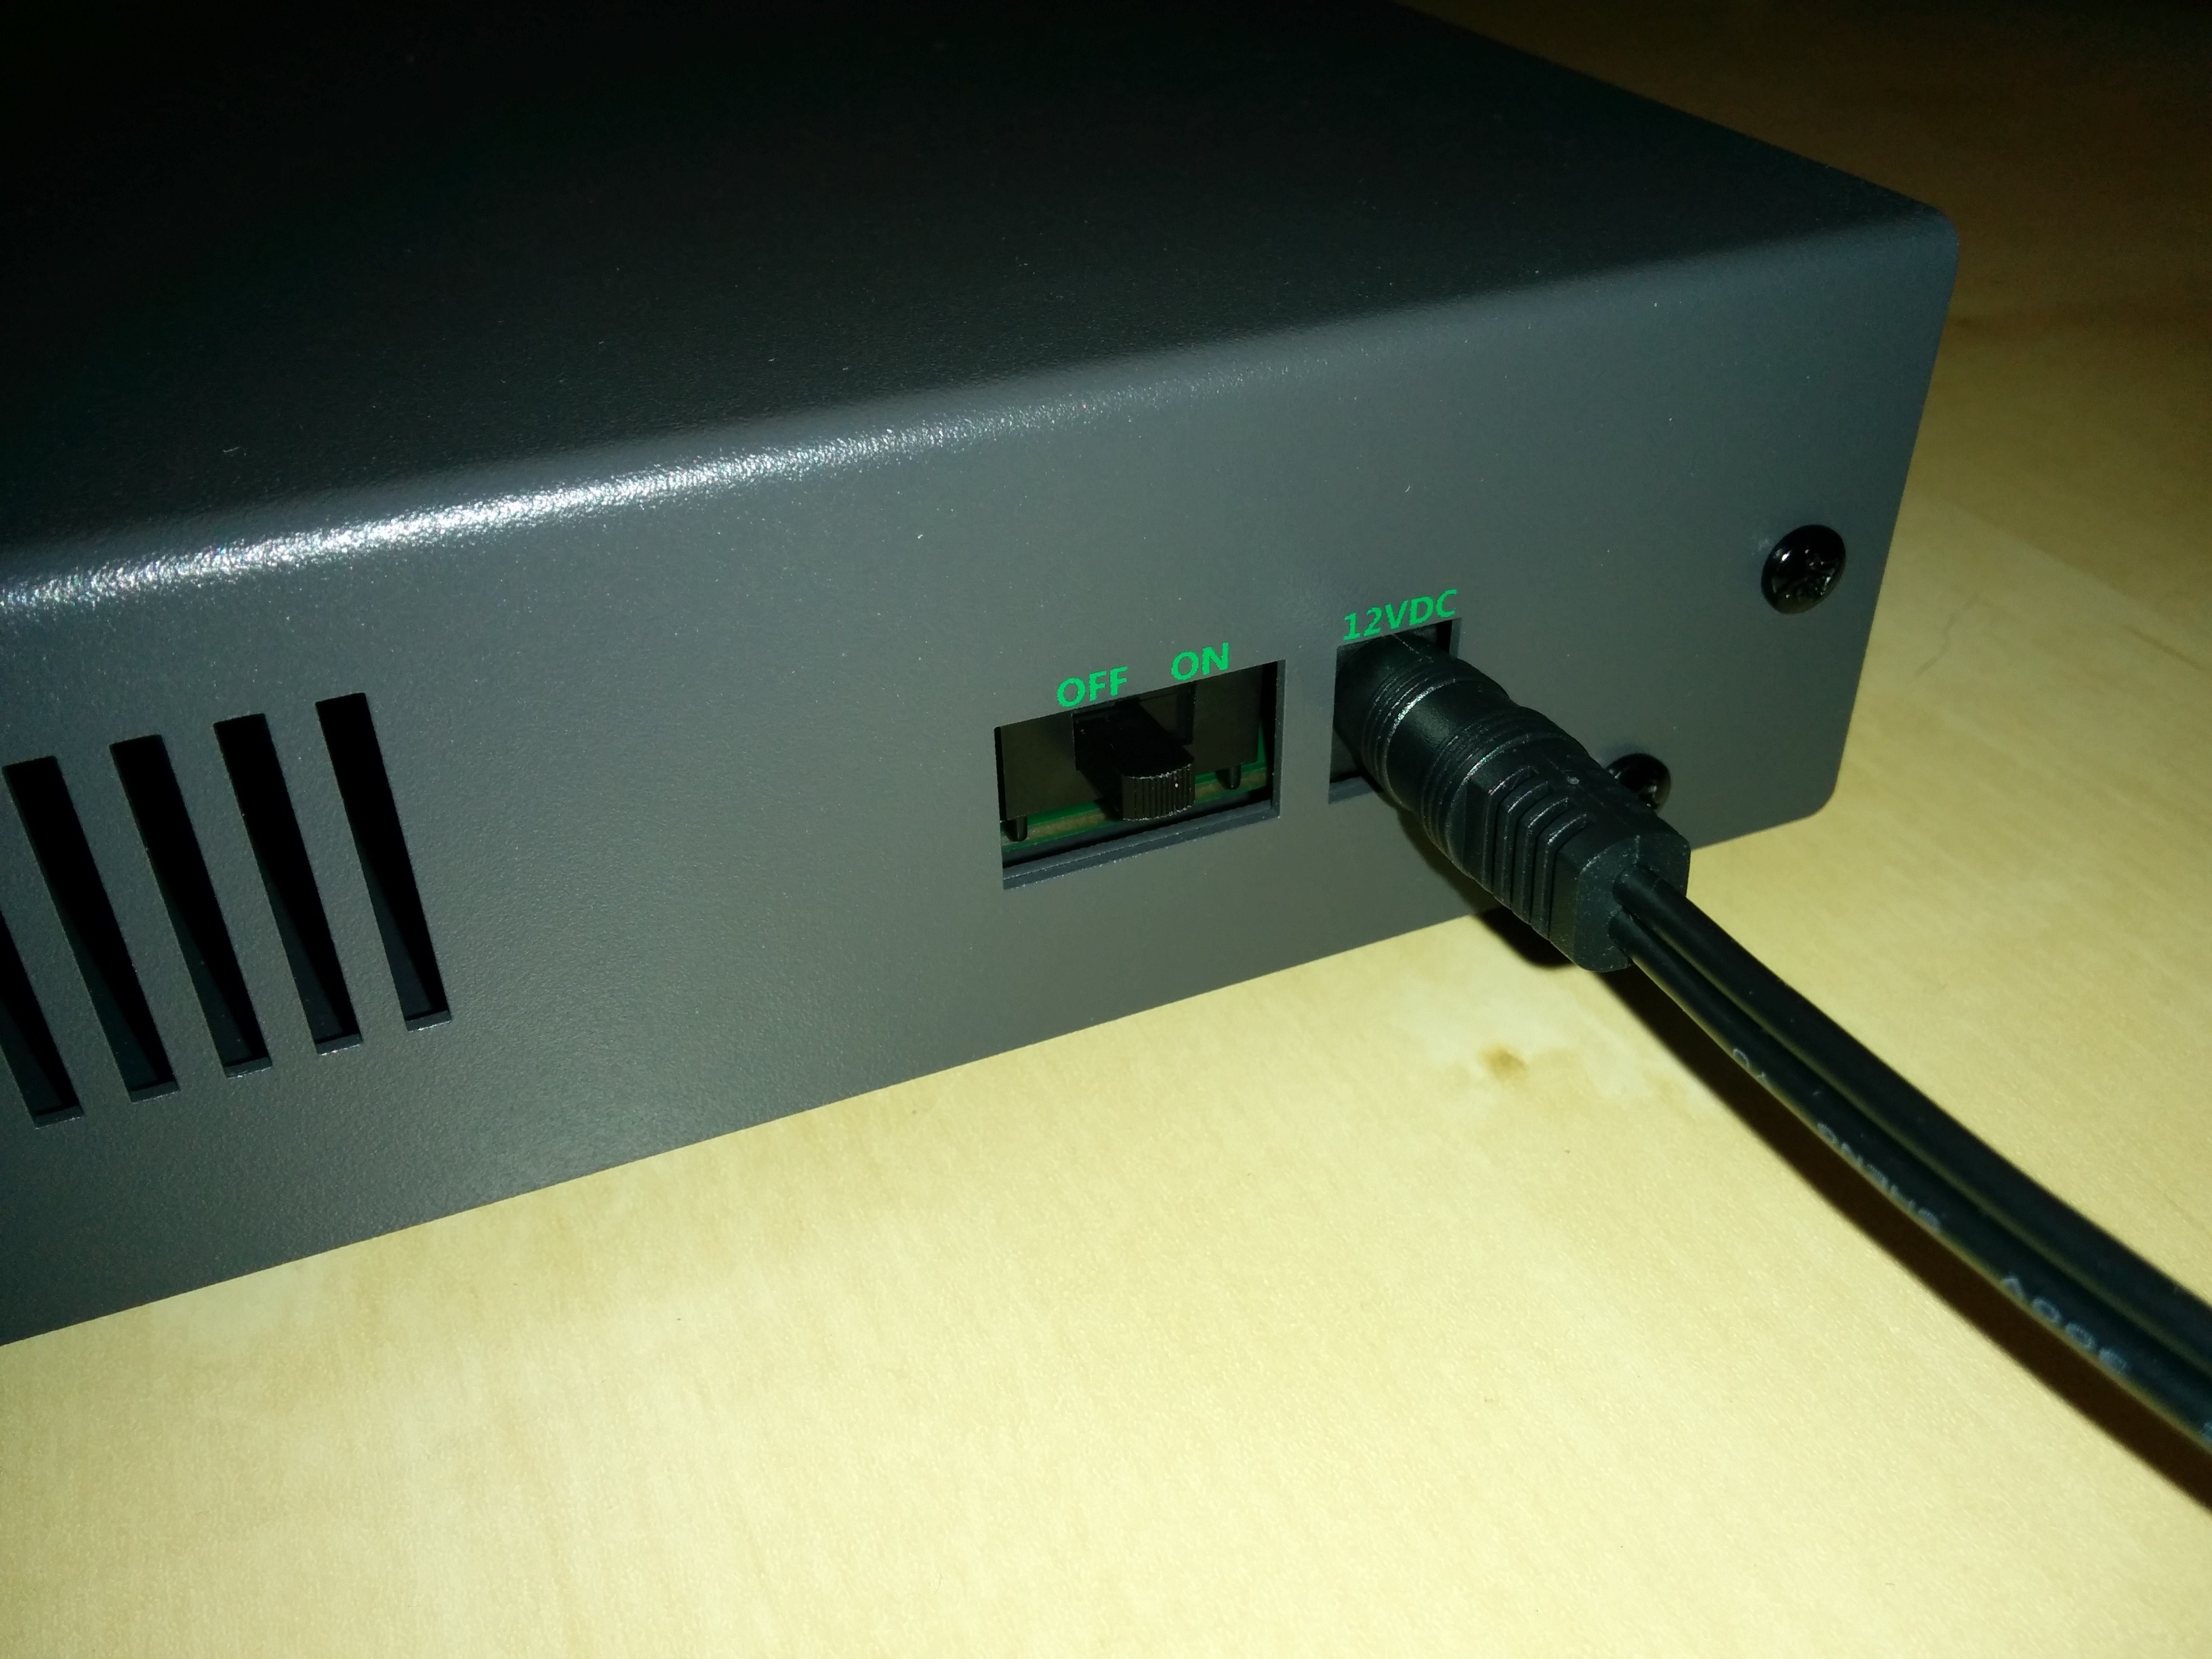
Figure 2. Datanode 12VDC power port and on/off switch.
Warning
All Willow Datanodes come with a floating 12VDC power supply, and are thus not grounded. This configuration allows the experimenter to chose how the Willow system is grounded for best signal quality, e.g. close to the animal. However, it also means that the experimenter must take care not to operate the Datanode in an ungrounded state such as with no headstages attached, lest static charge accumulate on the Datanode. Switching to a grounded power supply resolves any grounding concerns (since the Datanode is always grounded) at the risk of inferior signal quality due to increased noise.
- Connect TCP port and UDP port on Datanode to network switch (any two ports will do) using two Ethernet cables.
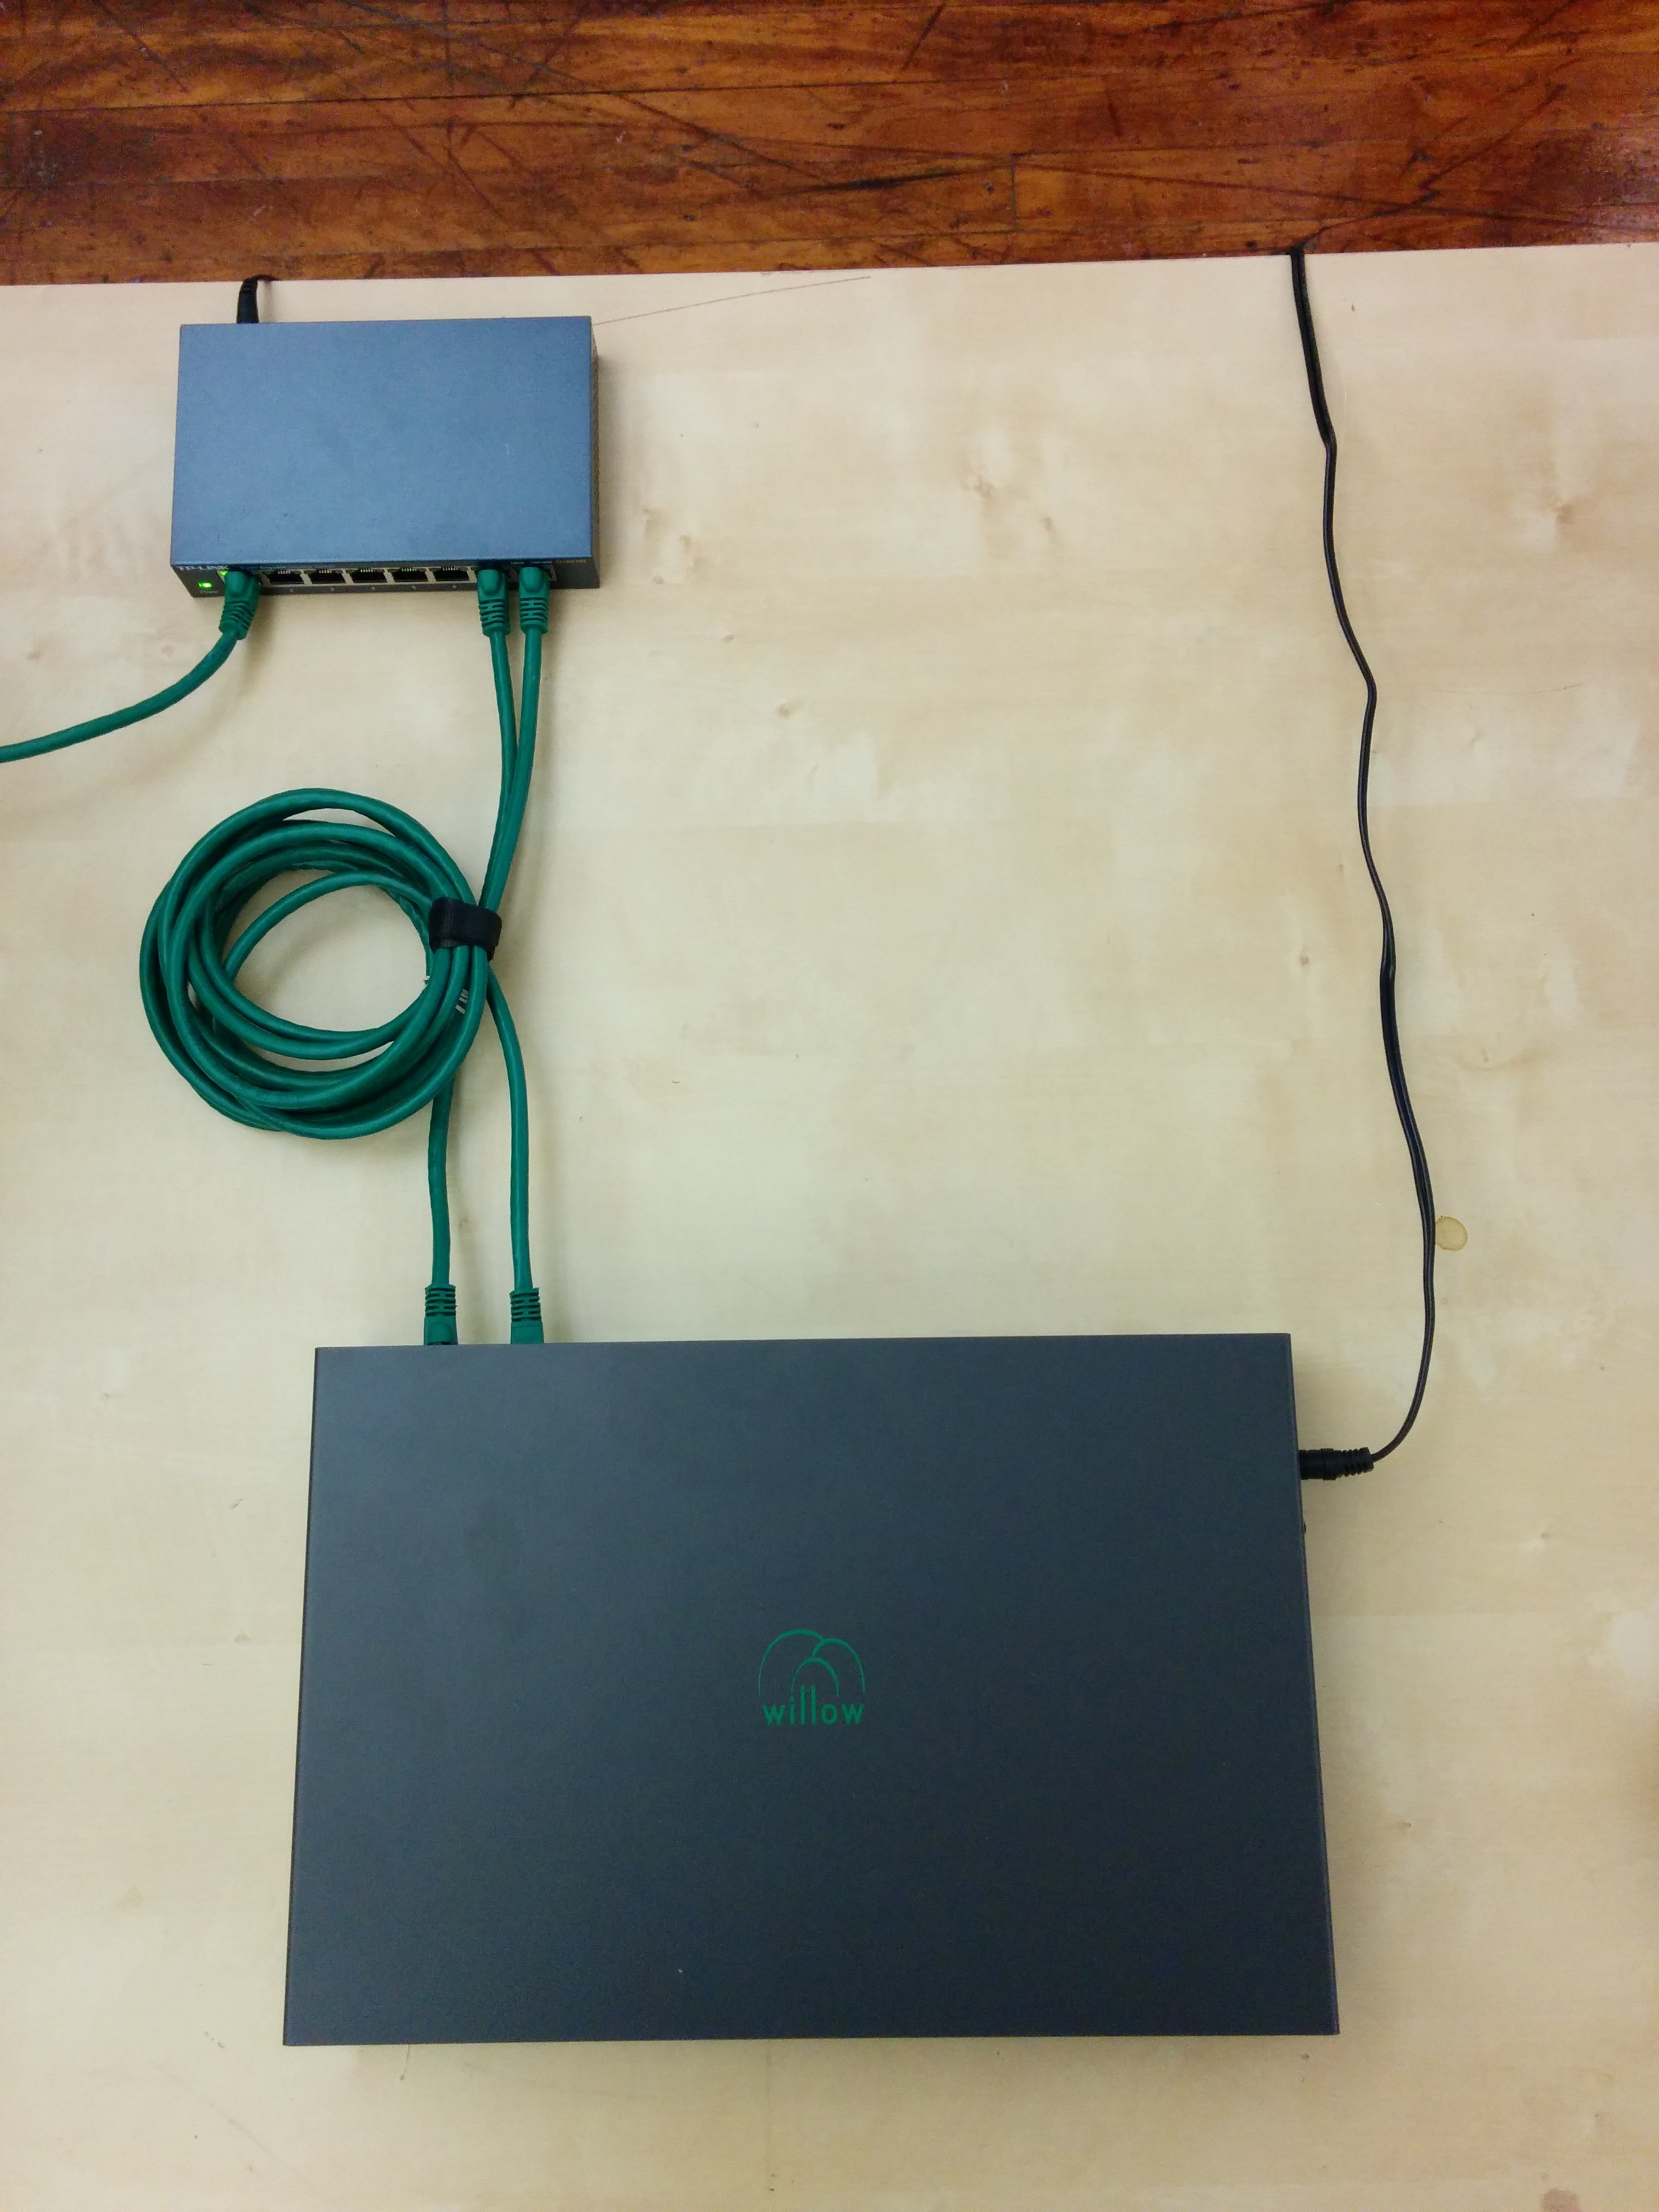
- Connect workstation to the same network switch via Ethernet cable. For information about networking with pre-configured workstations from LeafLabs, see Network Configuration.
- Connect Datanode to headstages via HDMI cables. Connect any Datanode MISO/MOSI paired-ports to respective MISO/MOSI paired-ports on any headstage. Repeat desired number of paired-port connections between Datanode and headstages, as needed. Arbitrary configurations of headstage connectivity at the MISO/MOSI interface is allowed, provided that at least one headstage is connected to the Datanode. If zero headstages are connected, then a snapshot will result in a timeout error.
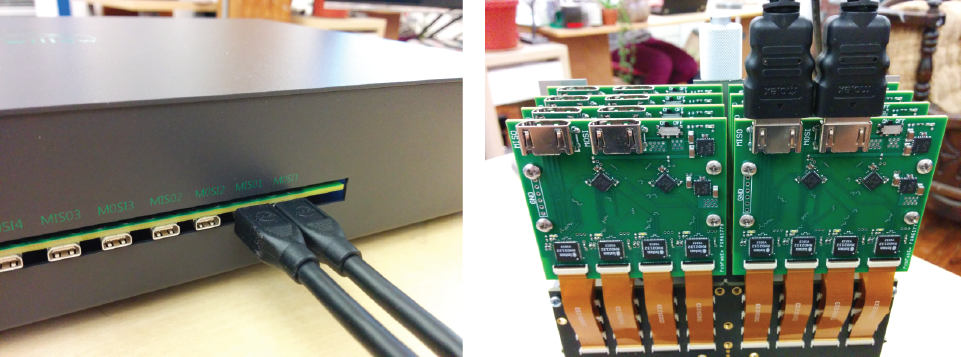
Figure 3. Example of Datanode paired-ports MISO1 and MOSI1 (left) connected to a headstage’s MISO/MOSI ports (right).
- Ensure that an SSD is in the drive bay.
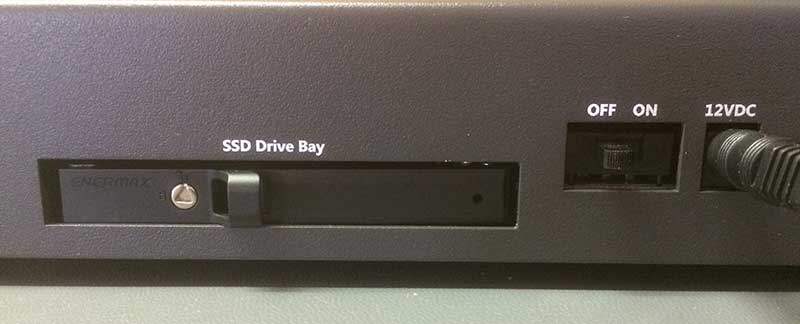
- Slide power switch on side of Datanode to ON position to power Datanode. Wait until white LEDs on headstages flash twice (takes about 15 seconds) and then remain dark. At this point, the connection topology should look as shown in System Overview.
Note
The status of LEDs (lit vs not) is random before completion of initialization.
Login to the Workstation
On a pre-configured Willow Workstation from LeafLabs, the default login account is leaf and password is helloworld.
Note
The default login account does not have root/administrator privileges, and thus cannot install software. Please contact LeafLabs for secure exchange of account details with root privileges.
Network Confguration
A pre-configured workstation from LeafLabs has two NICs - one built-in to the motherboard (labelled Internet) and a second as a PCI card (labelled Willow) - to allow internet access while communicating with the WiIlow datanode. Each NIC is configured for one purpose or the other but not both. Thus, it is important to establish correct connectivity by following the labels.
In case the labels are missing or illegible, correct connectivity can still be determined. To begin, in the case of reversed connectivity, WillowGUI will display no connectivity to DataNode (even though the datanode can be pinged at 192.168.1.2) and no IP address will be issued by DHCP to NIC intended for internet (as seen by running ipconfig at a command prompt). To restore proper function, swap the ethernet cables connected to the workstation. WillowGUI will display no connectivity to Datanode (see Figure 7.) even though the datanode can be pinged at 192.168.1.2, and no IP address will be issued by DHCP to NIC intended for internet (as seen by running ipconfig at a command prompt). To restore proper function, swap the ethernet cables connected to the workstation.
To support high data rate network traffic, it is important configure the size in bytes of network packets. If you’re using a pre-configured Willow workstation, this happens automatically upon startup. In the case of a non-pre-configured workstation, a utility script is included with the Daemon in willow-daemon/util:
$ cd leafysd/util
$ ./expand_eth_buffers.sh <interface>
where <interface> is the name of your network interface (default is eth0).
Note
This script requires sudo privileges. See Login to the Workstation.
GUI Startup
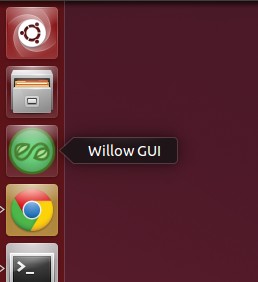
On a pre-configured Willow workstation, you can start WillowGUI by clicking the WillowGUI icon on the Unity Launcher side panel.
Alternatively, you can start WillowGUI from the top-level folder of the local repository (e.g. willowgui) with
$ src/main.py
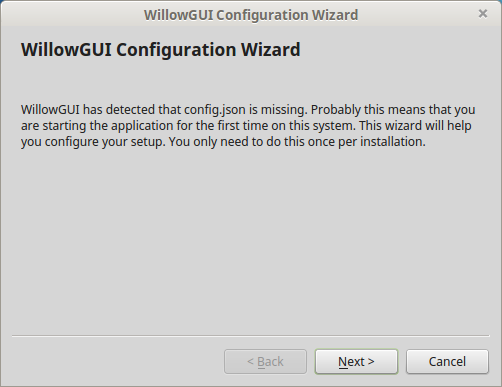
The first time you run the GUI, a Configuration Wizard will appear. Follow the instructions and click Finish.
If the setup was successful, the WillowGUI control panel will appear on the screen.
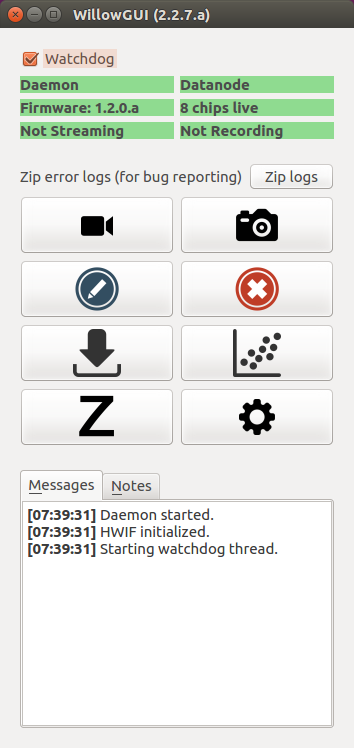
GUI Usage
This section is offered as a quick-start guide to basic GUI usage. For more in-depth documentation including installation instructions, please refer to the Willow Software User Manual.
- Stream live data:

Click this button to launch a Stream....UPDATE WITH LATEST.
Add figure
- Take a snapshot:

Click this button to take a snapshot, which is a short (1-10 second) sampling of all 1024 channels, stored in an HDF5 data file. A dialog box will appear in which number of samples to collect and the target filename can be entered. By default, the snapshot will be 1 second long (30000 samples) and have a timestamp-specific filename of the form:
snapshot_YYYYMMDD-hhmmss.h5.
Selecting “Plot When Finished” to open the snapshot data in a Plot Window (see Section 6).
- Start recording:

Click this button to start recording to the Datanode.
Warning
Each recording will start at the beginning of the disk, overwriting any previously recorded experiments. To ensure that no data is lost, make certain that any important experiments have been transferred off the Datanode (see Transfer Experiment below) before recording. While recording, the recording label in the status bar will turn red and list the current disk usage.
- Stop recording:

Click this button to stop recording. The ‘recording’ status bar will turn back to its green “Not Recording” state.
- Transfer experiment:

Click this button to transfer an experiment (i.e. previous recording) to the workstation. YA dialog box will appear in which the number of samples to transfer (or entire recording), and the target filename can be selected. Select “Name Automatically” to name the file with the UNIX time-stamp from when the recording was started.
- Plot data:

Click this button to plot data from a previously acquired recording or snapshot. A file browser will appear in which the desired file can be selected. A subsequent dialog box will appear in which the amount of data desired for import can be selected. Upon selection, a Plot Window will open in which channel traces can be viewed as line plots. (Fig. 8)
Click “Waterfall” near the top-right of the Plot Window to open a Waterfall Plot – a 2D spectrogram-like visualization with channel count on the y-axis, and time on the x-axis. (Fig. 9)
ADD FIGURES
Retrieve Data from SSD Using SATA-to-USB cable
Data can be pulled from SSDs at any time using the sata2hdf5 program that comes installed with the Daemon software. If not already done, first Install the daemon software. Then, using a SATA-to-USB adapter (one is included with every Willow system) attach to the PC one SSD, by first powering down the Willow Datanode and ejecting the SSD.
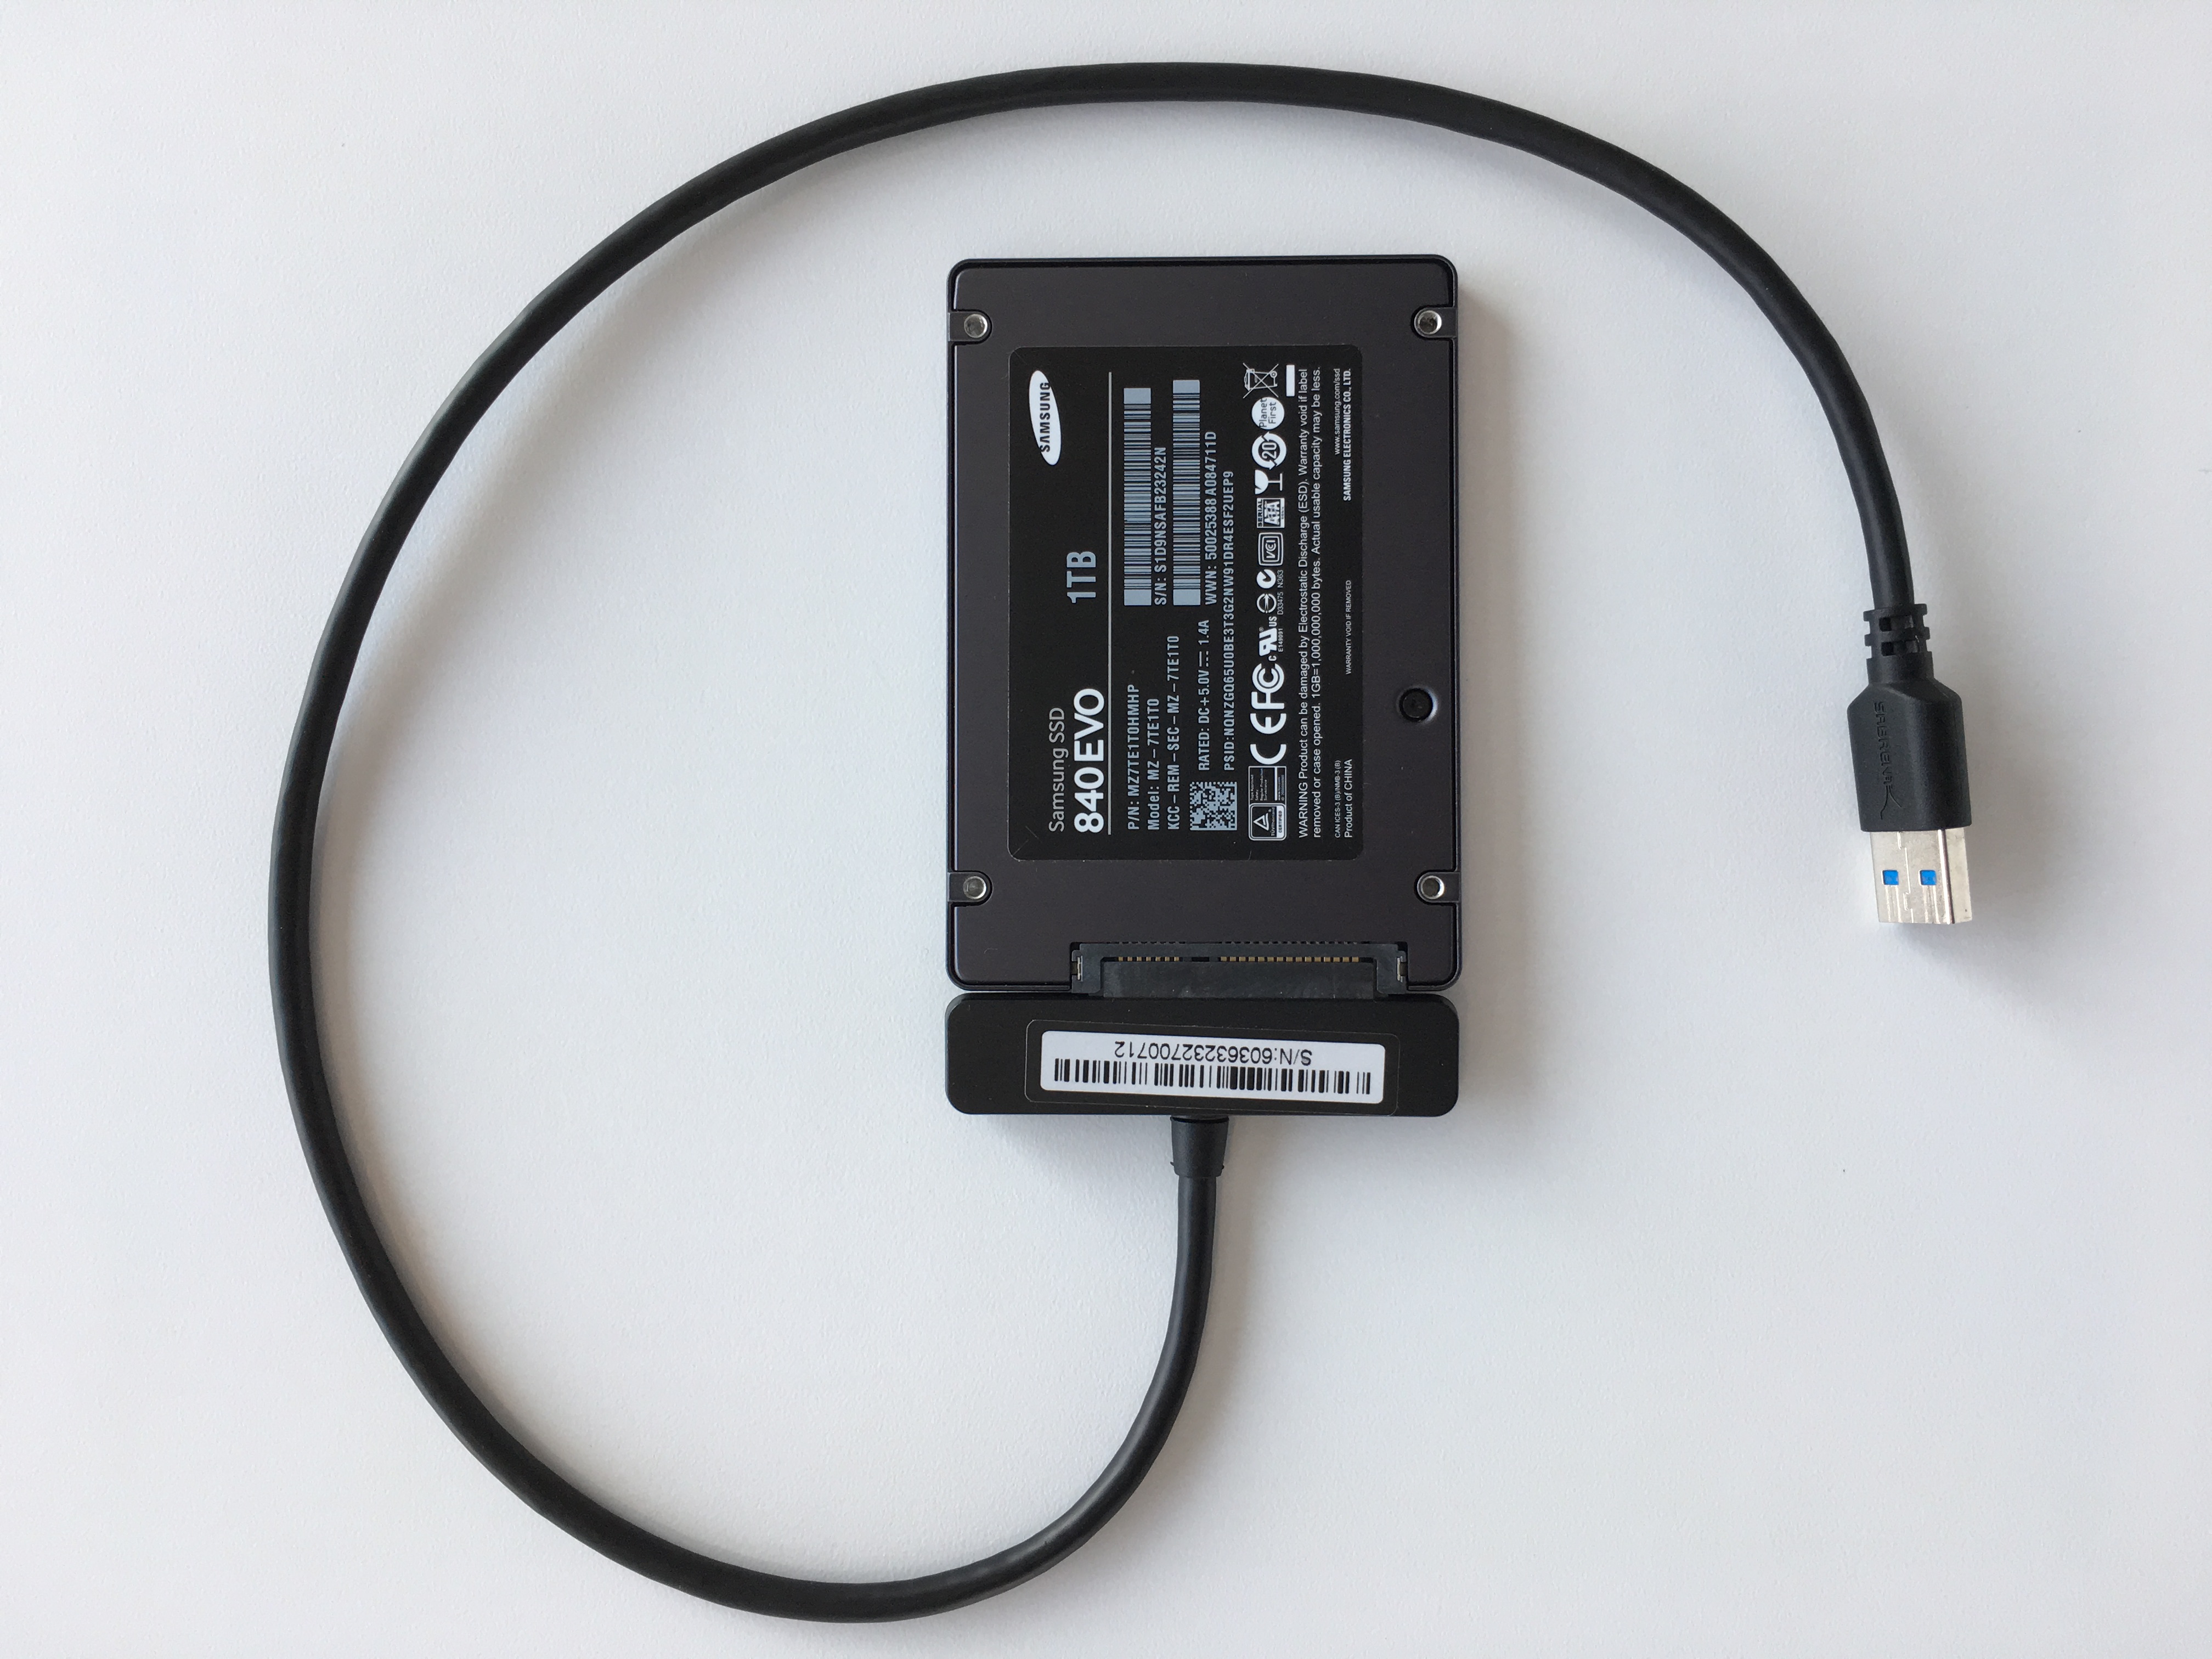
Figure 4. SATA-to-USB adapter with SSD attached.
Note
To ensure that the PC operating system quickly registers the SSD, connect the SSD to adapter first, then connect adapter to USB connector on PC.
Then,
- Determine the device name assigned to USB-to-SATA adapter by running ls /dev/sd*` before and after attaching the adapter. The new device name is the desired one.
- Determine the start time of data (recording on SSD), i.e. the UNIX time on the laptop when recording started.
Example:
$ sudo ~/src/willow-daemon/build/sata2hdf5 -c 30000 -o 0 /dev/sdd test.h5
Starting cookie: 0x57000886
Starting board id: 0x3746f441
Copied 30000...
Copied 30000 board samples.

0x57000886 = 1459619974 seconds since epoch = 2016-04-02 13:59:34+00:00 EST.
- From snapshots (which have time embedded in filename), calculate the sample offset (which determines where in SSD to start extracting data). So, for data at 15:00 EST: sample offset = 15:00-14:00 = 60 minutes = 3600 sec = 3600*30e3 samples = 108000000.
- Decide how many samples we want, e.g. 1 min = 60 sec*30e3 samples/sec = 1800000.
- Finally, run sata2hdf5:
$ sudo ~/src/willow-daemon/build/sata2hdf5 -c 1800000 -o 108000000 /dev/sdd data_offset_1hr_length_1min.h5
Note
At this time obtaining a subset of the channels (e.g. 64 out of 1024) is not possible unfortunately, neither through WillowGUI or from sata2hdf5.